Western Australia Exploration Geochemistry Online - wamexgeochem.net.au
A facility to search for and download open file surface and downhole geochemistry data from exploration company datasets in GSWA’s Mineral Drillholes Database.
Data in the ‘geochemistry tables’ in the database have been harmonised by standardising company analyte names and units.
Use the “Downhole assay” and “Surface assay” pages to execute searches using various criteria. Results will be displayed for viewing on-line. You can also choose to download your search results in a .zip archive.
Retrieved data for download are provided as a set of .csv files containing drillhole/sample and assay details (one record per assay with both source and harmonised fields) and as a pivoted table of samples in rows by harmonised analyte assay values in columns (plus the option to download additional data for DH searches).
You can select at download time which, if any, additional DH data you want included in the .zip archive.
How to use the search/query/download features
The search pages allow you to query the data using specific selection criteria and then download the resulting dataset so that you can further examine the data using your software of choice.
This facility is intended to be used for specific enquiries (using the provided criteria and/or latitude and longitude boundaries/polygon). If you wish to work with the complete database, don’t try and search/download via these pages – there are “full database” packages and pivoted versions of “All WA” data available for download from here and the GSWA website in various formats.
Limits can be set on the number of records returned, so that you can check/refine your search parameters on a smaller subset of data first.
There is a ‘resource governor’ implemented on this site and overly large queries/searches that use too much server resources may be terminated with an explanatory message returned to the user.
Repeated submission of such queries may result in a temporary IP address ban. Use of ‘bots’ may also result in a ban.
Both the Downhole (DH) and Surface Sample (SS) search pages have similar features.
These pages allow you to search the database using one or more of the search criteria displayed at the top of each page.
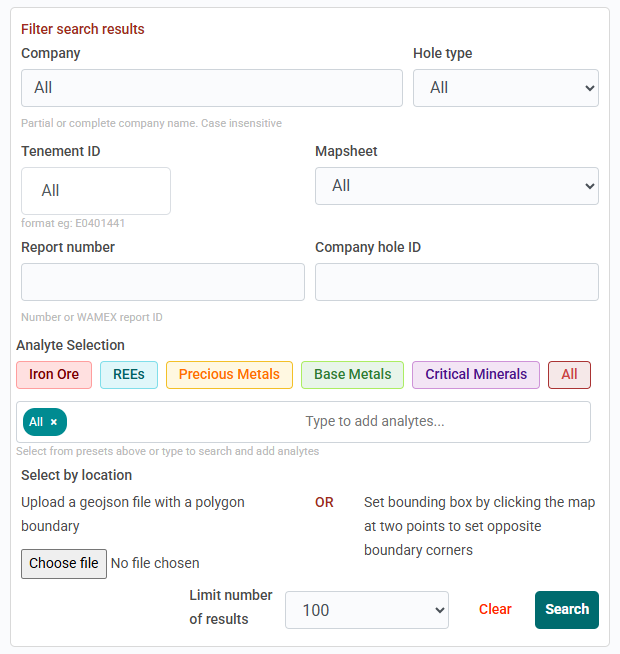
The search fields work in various ways to filter your search results, as described below:
Limit:
This field is used to restrict the number of Collars/Samples returned by your query. Various values are available in this dropdown list and we recommend that you start with a small number first to ensure you are getting the desired results from your other selection criteria.
Company:
Free-text field. You can enter a partial or complete Company name here. The query will return records where the entered string value is found. This field is case-insensitive.
Hole Type/Sample Type:
Dropdown list, from which you can choose a single Hole/Sample Type.
Mapsheet:
Dropdown list, from which you can choose a single (250k) Mapsheet.
Report Number:
Free-text field. The ‘ANumber’ – or WAMEX Report id.
Company Hole/Sample ID:
Free-text field.
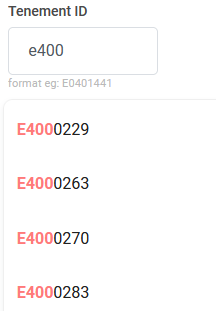
Tenement ID:
Start typing your desired Tenement ID in and you will see a list of Tenements matching that value - you can then select the Tenement you wish to search on. Note: Tenement ID’s in the database have been standardised to the following format: E0401441 e.g.
You can use the ‘Clear’ button to reset your search criteria at any time.
Submit your search using the ‘Search’ button.
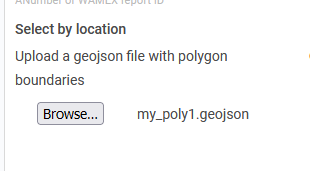
Searching via uploaded polygon file:
If you wish to search in a specific / custom polygon, this is possible by using the “Browse…” button to select and upload a file in the .geojson format. These files can be created from within various GIS packages, e.g. QGIS.
The geojson file should contain a single polygon only. The uploaded geojson file should be in the format:
{
"type": "FeatureCollection",
"name": "my_poly1",
"features": [
{ "type": "Feature", "properties": { "id": null }, "geometry": { "type": "Polygon", "coordinates": [ [ [ xx.xxxx, yy.yyy ], [ xx.xxxx, -yy.yyyy], ... ] ] } }
]
}
For example:
{
"type": "FeatureCollection",
"name": "my_poly1",
"features": [
{ "type": "Feature", "properties": { "id": null }, "geometry": { "type": "Polygon", "coordinates": [ [ [ 117.204050852514371, -30.174921788842042 ], [ 117.144699587924976, -28.883922377382905 ], [ 118.969753564839309, -28.870929637712234 ], [ 120.141942660868395, -29.76359786627318 ], [ 119.800672350458058, -30.788697904385355 ], [ 117.574996686217162, -31.7020488855119 ], [ 117.204050852514371, -30.174921788842042 ] ] ] } }
]
}
The website will ‘remember’ your .geojson file selection until you use the “Clear” button to reset your search criteria.
Searching via rectangular map bounds:
If you wish to search via certain geographic bounds, you can select the desired search area directly from the map.
Zoom the map in to your approximate area of interest.
Then click once on the top left corner of your desired area. This will place a marker on the map.
Click again in the bottom right of your desired area. This will place a second marker and show the rectangular bounds.
Selecting elements/assays of interest:
You also have the option to restrict the pivoted assay results and associated assay csv downloads to only those elements/analytes that you are interested in. This helps you target your searches to specific or predefined groups of elements.
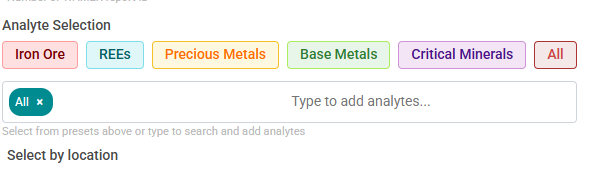
The default selection is ‘All’ but you can easily select one of the predefined groups by clicking on the relevant button - e.g. ‘Precious Metals’:
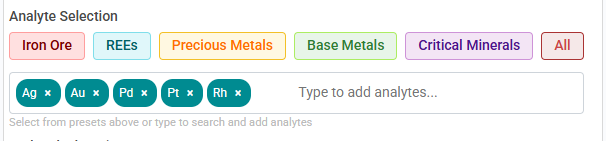
You can also add ‘custom’ elements to your selection using the ‘free type’ area:
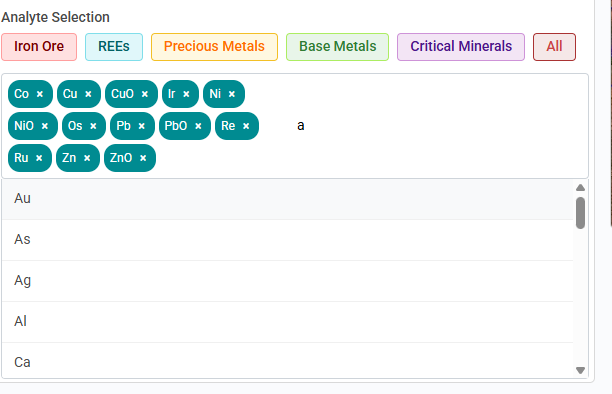
Or only select ‘custom’ elements of your choosing:
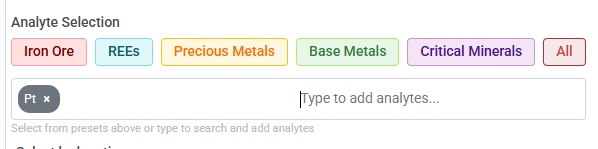
This feature can be used to restrict/target the pivoted assay display on screen and the associated assay/pivoted assay csv files if you download your search results.
Search results:
Once you submit your search query, the results will be displayed on-screen. Depending on the nature of your search this may take anywhere from 2-3 seconds to a minute.
The initial results are shown as a ‘summary’ table of Collars/Samples together with their locations on the adjoining map – see the example below:
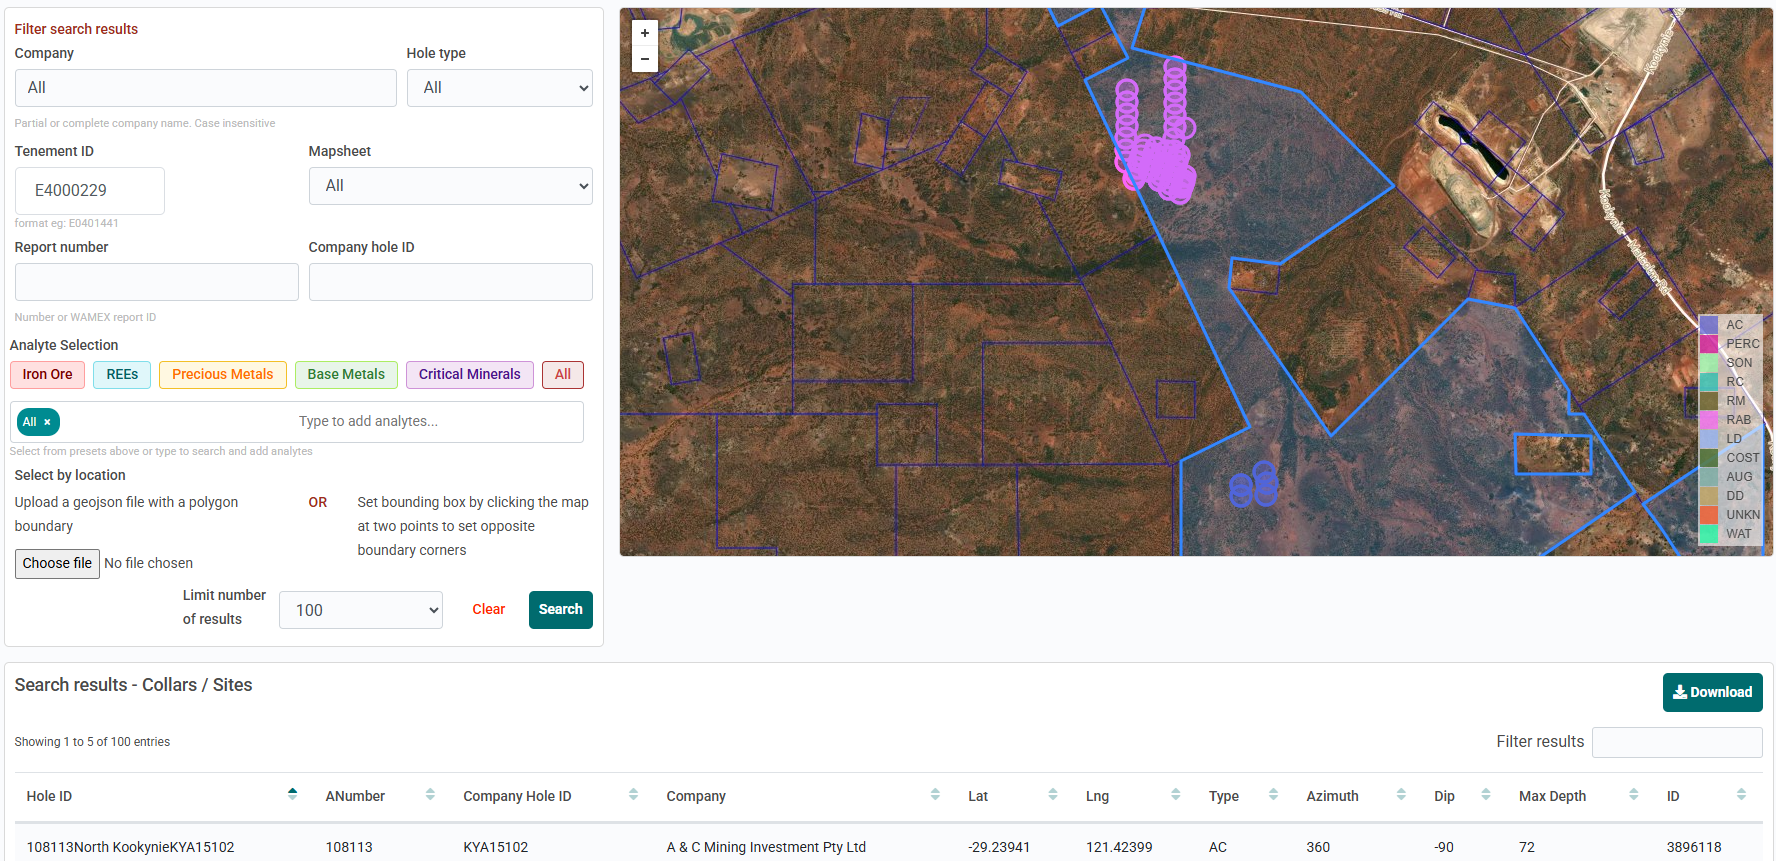
You can see that basic Collar/Sample results are shown in the table. If you search via Tenement ID, as in the example above, the tenement outline is also shown on the map (tenement outlines will also be shown at certain map zoom levels).
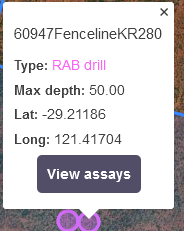
In the map display, if you hover the cursor/pointer over a single Hole/Sample, the cursor changes to a “Pointing Finger”. Click to see more information about that Hole/Sample – you can also then click on the ‘View Assays’ button to display more results for that item.
Downloading the search results:
From here, you can choose to download the whole of your selected dataset to a local file for further detailed investigation, using the “Download” button.
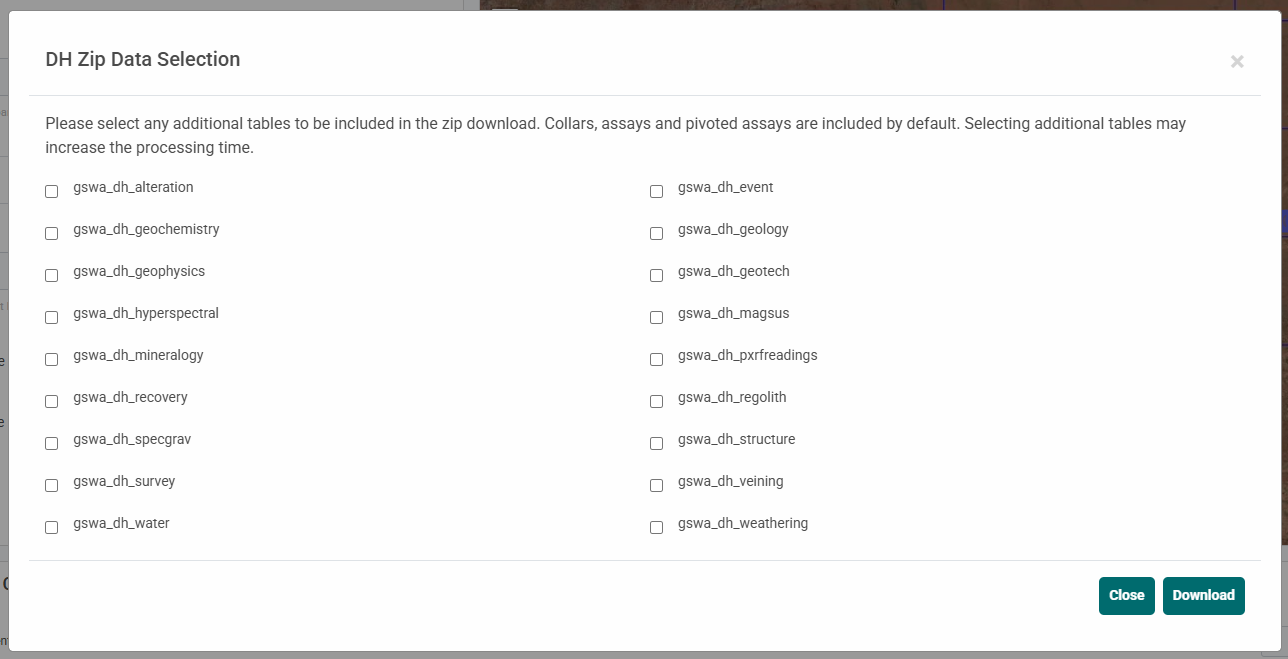
This will return a zip archive consisting of csv files for your selected Collars/Samples and the associated Assays plus a pivoted assay dataset, plus any additional data for DH searches, as chosen at download time, as per the dialog below:.
Creating and downloading the zip archive may take some time. You will be shown a progress indicator while this takes place.
When zip generation is complete, you will be prompted to save the file. If your browser has a ‘pop-up’ blocker that is detected, then an alternate ‘manual’ download link will be provided.
If no data is found for a selected ‘additional’ DH table, a CSV file will still be produced, with a ‘No Data Returned’ message in the first data row.
Investigating the search results online:
However – you may wish just to examine the data further online, either without or before downloading.
If you click on an individual Collar/Sample row, this will highlight the row and the ‘Get Assays’ button beneath the table.
Clicking on ‘Get Assays’ populates and displays detailed results for that Collar/Sample.
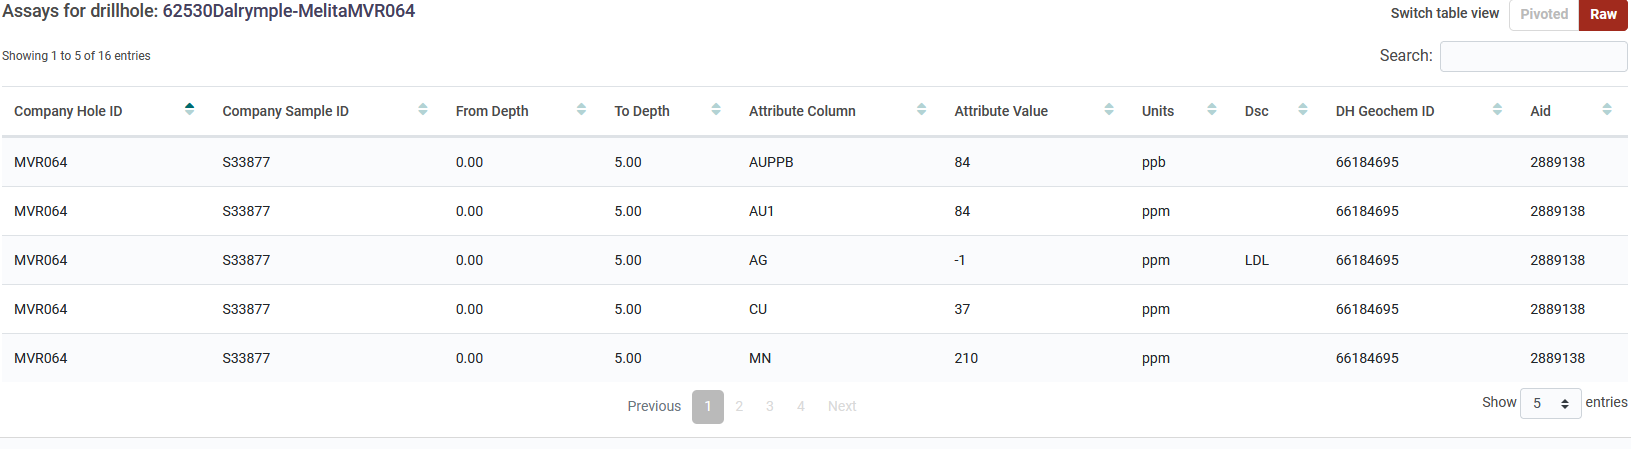
The “raw” Assay results for the selected Collar/Sample, in a one line per assay/analyte basis. This can return many rows for a deep hole and/or where there are many analyte results (some holes may have thousands of entries here, so returning them may take a few seconds).
The Assay data can also be shown in a “Pivoted” form – assays/intervals are shown as a single row with all harmonised analyte results shown across the page. In the event of multiple assay results for the same analyte for an interval/sample, the highest value will be shown in the pivot table. If there are too many elements to display in the grid, a small “+” button will appear – when clicked, this will display the additional analytes/elements.
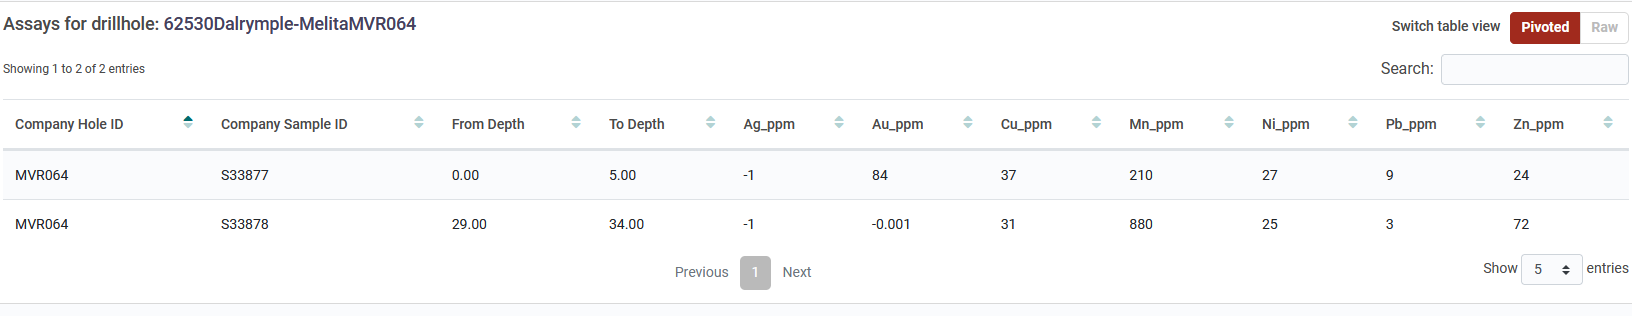
You can switch between the “raw” and “pivoted” views as required.
These tables allow you to perform basic analysis to allow you to decide to download or further refine a dataset for further investigation.
Analyte names have been standardised to account for the many variances within the original data, and the displayed results have been standardised to ‘PPM’.
No Assay results?
There may be occasions when you select a Collar/Sample and click ‘Get Assays’, but no assay results are found.
The 2 most common reasons for this are:
-
The selected Collar/Sample appears in multiple ‘aNumber’ reports, and not all of them have assays. In such cases, there may be multiple entries for the same Collar/Sample in your search results – one (or more) of which will have assays associated with them.
-
There are no assay data in the database as collar locations have been extracted manually from PDF copies of older reports. The data assay may be found by looking at the original report.
Data Harmonisation Process:
Company analyte column headings as supplied in submitted datasets were programmatically matched to standard analyte names in a ‘match table’ (available for download from this website). The ‘type’ of match for each original value is shown in the table.
Scripts were run on the original database to harmonise the company analyte names to the matched standard analyte names, and to recalculate assay values in the company-supplied units of measure as ppm. Locations are in Lat/Long GDA2020.
Important Note
The data in the tables have been extracted from the Mineral Drillholes Database which stores the assay data as supplied by mining and exploration companies. There has been no quality control carried out on the actual results.
It is incumbent on the user to check the original reports if there is any doubt about the validity of the harmonised data.
In carrying out this exercise a number of potential data errors have been identified. The most common is with the units of measure that have been supplied by the company. Any suspicious/unexpected units of measure should be checked and disregarded if found to be outside normally expected values.
No corrections have been made to units of measure values at this time. It would be appreciated if any spurious data could be reported to wamex.enquiries@dmpe.wa.gov.au
Other Downloads
Also available for download from this website:
Postgres format version of the “All WA Pivoted DH and SS” dataset (derived from the original SQL Server version supplied by GSWA) and Postgres format backups of the tables used by this website.
License
Unless otherwise noted, and with the exception of logos, images, and other material or devices protected by a trademark, data downloaded from this website is licensed under a Creative Commons Attribution 4.0 International licence.

To view the terms of this licence visit: https://creativecommons.org/licenses/by/4.0/legalcode
Please give attribution to: © State of Western Australia (Department of Mines, Petroleum and Exploration) 2025. We also request that you observe and retain any copyright or related notices that may accompany this material as part of the attribution. This is also a requirement of the Creative Commons Licences.
Under this licence you are free to use this information in accordance with the licence terms without having to seek permission from Department of Mines, Petroleum and Exploration material.
If you have modified or transformed the Data, or derived new material from those downloaded in any way, the following attribution must be used: Attribution: Based on Department of Mines, Petroleum and Exploration material.
This document last updated: January 2026